In modern healthcare, where innovation directly results in saving more lives, the recent uptake in the use of Tableau dashboards for healthcare analytics represents a strategic leap into a new era of data utilization for proactive patient care.
The vision for healthcare facility dashboards goes beyond adaptation, it helps hospitals be proactive. These dashboards aim to provide a platform for critical business decisions and, most importantly, enhance the quality of patient care outcomes. This shift reflects a steadfast commitment to embracing technological advancements and ensuring that healthcare providers are well-equipped to navigate the complexities of the modern healthcare system.
MarketsandMarkets projects the global healthcare analytics market to hit USD 64.5 billion by 2027. Tableau is crucial in this growth, translating data into actionable insights and driving a 15% cut in operating costs and a 10% revenue boost for healthcare organizations. Our advanced healthcare analytics can integrate seamlessly with Tableau to provide deeper insights. Institutions like Mayo Clinic and Cleveland Clinic credit Tableau dashboards for streamlined operations, lower readmission rates, and optimized revenue cycles.

To understand how these dashboards are reshaping healthcare, let’s explore key dashboards that could transform our approach to managing healthcare facilities.
Consolidated View Dashboard
The Consolidated View Dashboard is a comprehensive tool that provides patient details by entity. It categorizes information using key performance indicators (KPIs) such as Case Mix Index (CMI), length of stay, variable costs, and more. These KPIs are further categorized by financial class and providers.
What could make this dashboard invaluable is the historical context it offers to the healthcare leadership. Historical data records spanning years can be fed into the system, and the dashboard can enable trend analysis and performance comparisons for continuous improvement.
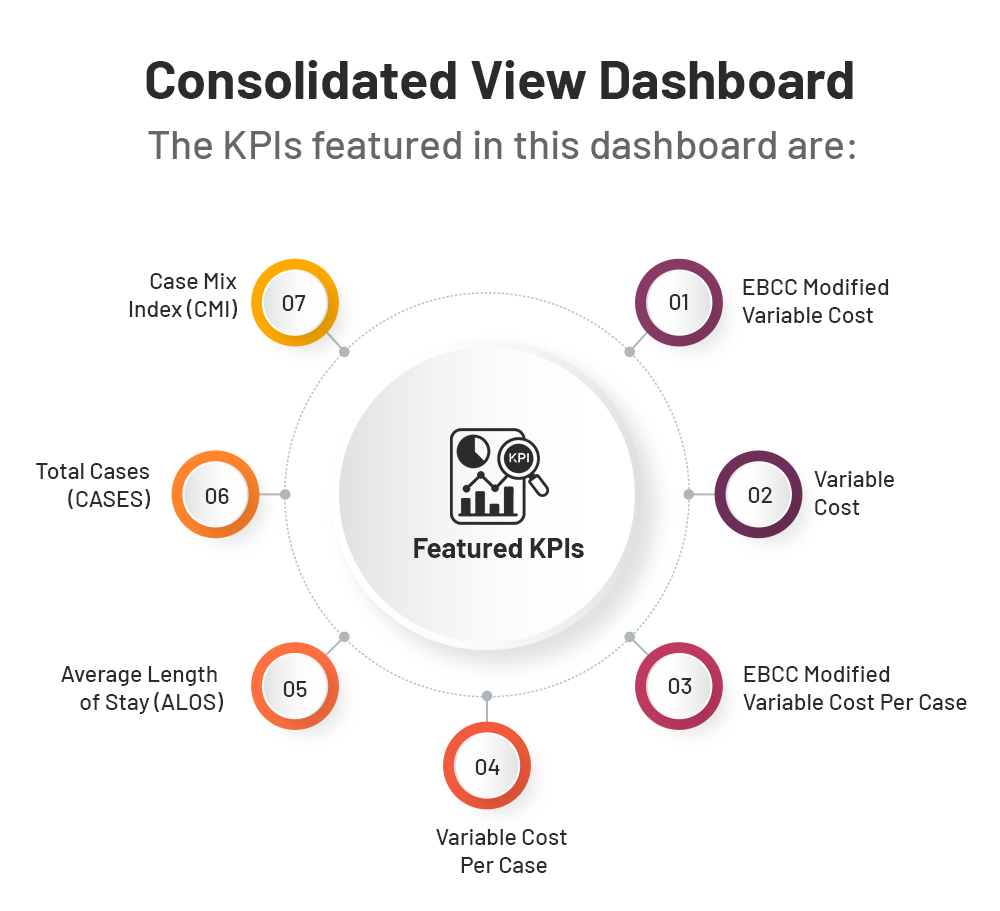
The KPIs included in this dashboard are:
- EBCC Modified Variable Cost
- Variable Cost
- EBCC Modified Variable Cost Per Case
- Variable Cost Per Case
- Average Length of Stay (ALOS)
- Total Cases (CASES)
- Case Mix Index (CMI)
This dashboard can empower a healthcare facility’s team with a comprehensive view of their operations, enabling them to make data-driven decisions that enhance patient care and optimize resource allocation.
Executive Summary Dashboard
The Executive Summary Dashboard offers a high-level overview of patient populations categorized by MS DRG (Diagnosis-Related Groups) codes. It provides KPIs for Total Cases, Variable Cost, and Modified Variable Cost, both in total and per case values.
This dashboard is unique in its ability to potentially drill down into account-wise details, including financial class, variable costs, modified variable costs, DRG severity, and financial class. Apart from setting a benchmark for comprehensive assessment, it could offer crucial insights.
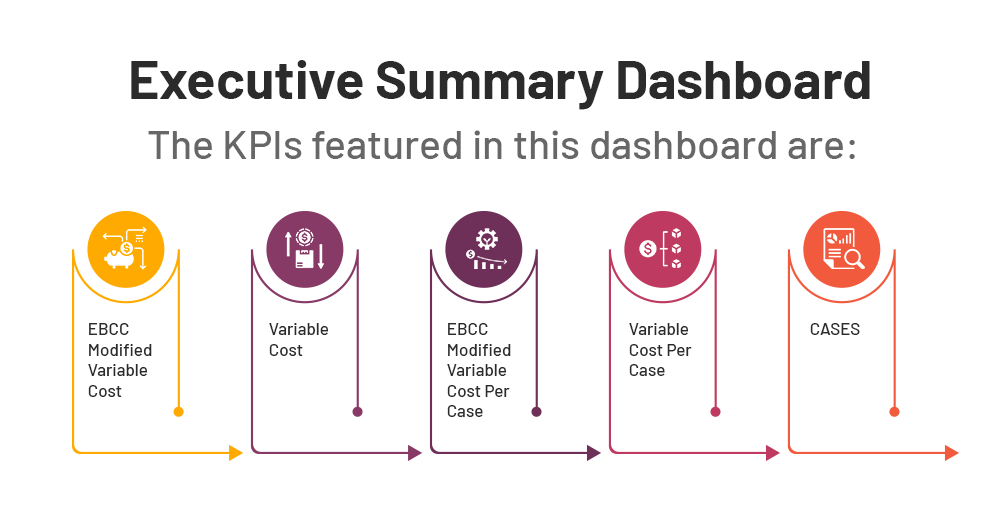
The KPIs featured in this dashboard are:
- EBCC Modified Variable Cost
- Variable Cost
- EBCC Modified Variable Cost Per Case
- Variable Cost Per Case
- CASES
This executive-level view could provide a holistic understanding of a healthcare facility’s patient populations, enabling informed decision-making for better patient outcomes.
Sepsis Dashboard
Sepsis is a critical medical condition that demands timely and effective management. The Sepsis Dashboard can offer comprehensive insights into inpatient sepsis populations, categorizing them based on Diagnosis Codes, APR (All Patient Refined) severity levels, and specific healthcare entities involved.
Curious about the impact BI dashboards have on healthcare leadership?
Learn how Predictive ML models for executive dashboards shape superior healthcare outcomes.

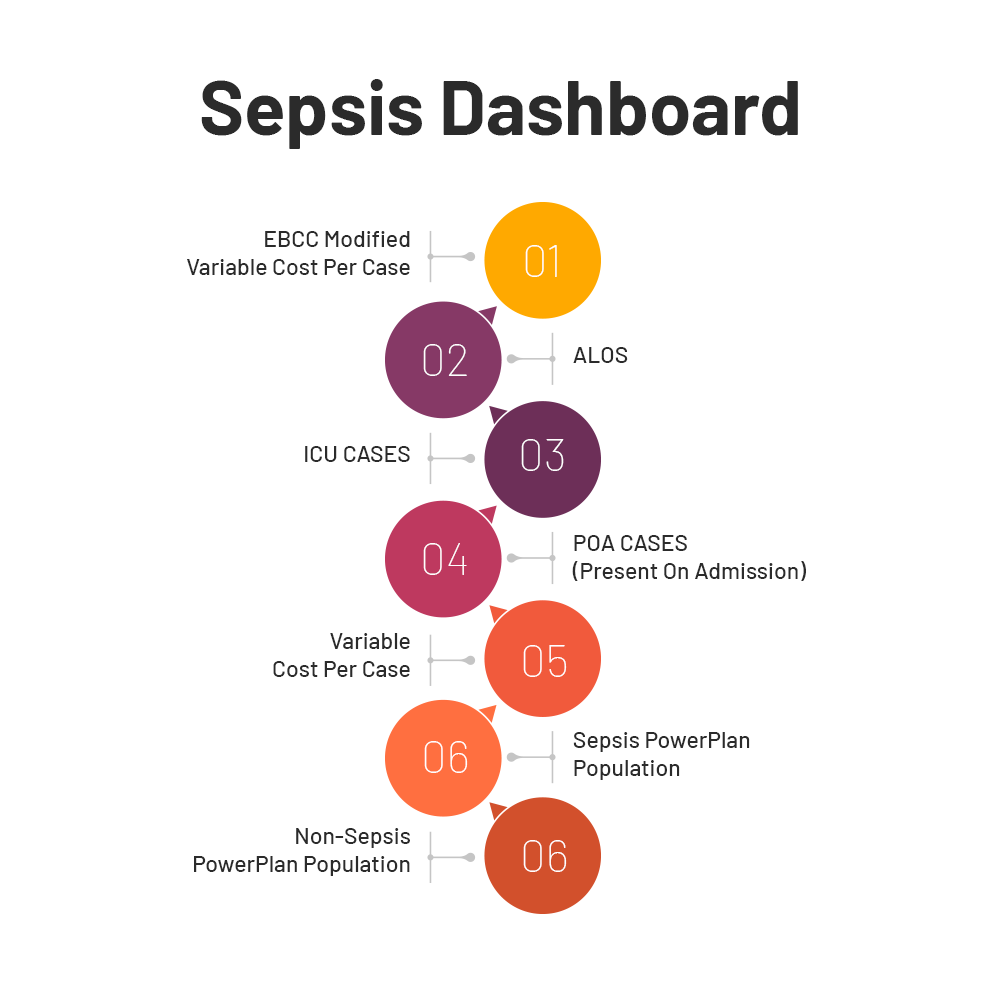
Key Performance Indicators (KPIs) in this dashboard could include:
- EBCC Modified Variable Cost Per Case
- ALOS
- ICU CASES
- POA CASES (Present On Admission)
- Variable Cost Per Case
- Sepsis PowerPlan Population
- Non-Sepsis PowerPlan Population
This tool, if implemented, could equip healthcare professionals with the vital information needed to monitor and manage sepsis cases effectively, ultimately saving lives.
Powerplan Dashboard
In healthcare, powerplans play a pivotal role in standardizing and streamlining patient care. The Powerplan Dashboard can offer detailed insights into these powerplans through four key dashboards:
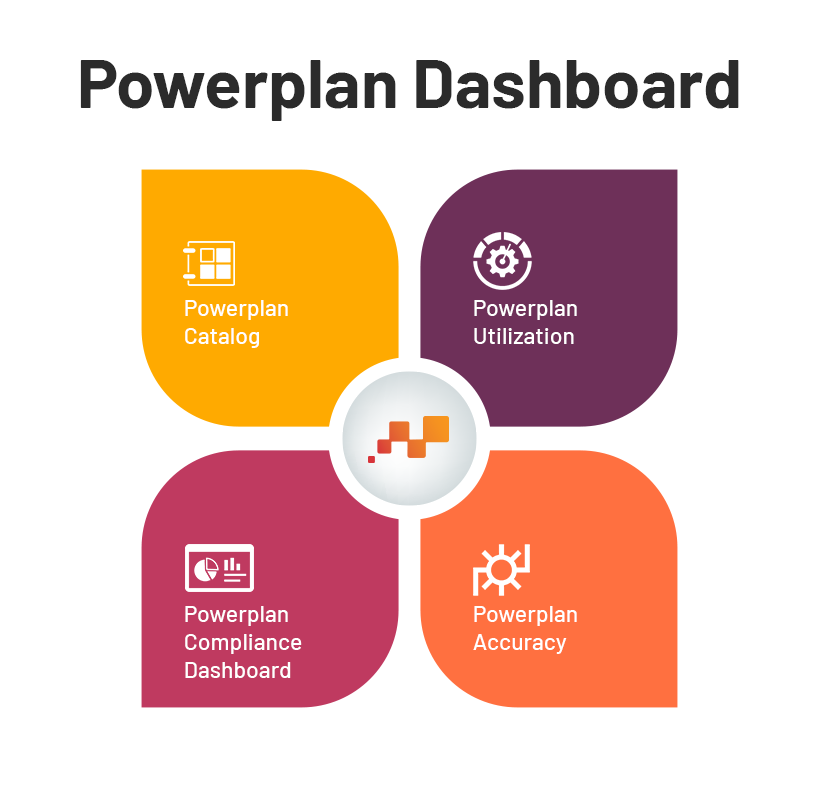
Powerplan Catalog
- This dashboard could serve as a comprehensive catalog of power plans, including both active and inactive plans, along with their complete historical records. It could provide transparency into the potential evolution of care protocols.
Powerplan Utilization
- The Powerplan Utilization dashboard could offer reports on all powerplans ordered, with the ability to filter by entity, EBCC PowerPlan, and Ordering Provider. It could aid in understanding how different entities and providers might utilize these plans.
Key KPIs include:
- Total PowerPlans
- Total EBCC PowerPlans
Powerplan Compliance Dashboard
- This dashboard is designed to monitor provider utilization of EBCC PowerPlans, particularly in the context of final coded EBCC MS DRG patients. It includes a specific report for EBCC ED PowerPlan Compliance, focusing on ED provider compliance with EBCC ED PowerPlans.
Key KPIs include:
- Total EBCC Accounts
- Total EBCC PowerPlan Accounts
Powerplan Accuracy
- Accuracy in the context of EBCC PowerPlans refers to the precise initiation of specific plans within the targeted EBCC MS DRG patient population. This dashboard’s role could be to provide in-depth analysis and insights into the accuracy of these plans, ensuring that they are consistently applied to the appropriate patient groups.
Key KPIs include:
- Denominator
- Numerator
- Total Aggregated Accuracy Percent
Healing with Algorithms: AI’s Role in Healthcare

Healthcare Analytics: Transforming Patient Care and Hospital Management
Tableau dashboards mark a significant milestone in healthcare analytics, poised to transform decision-making for healthcare facilities. These dashboards hold a promise to transform patient care, operational efficiency, and financial sustainability.
The Consolidated View Dashboard offers historical insights and trend analysis, fostering continuous improvement. Simultaneously, the Executive Summary Dashboard’s unique exploration shapes informed decision-making for optimal patient outcomes.
Addressing critical medical conditions like sepsis, the Sepsis Dashboard demonstrates healthcare analytics’ potential in managing diverse patient populations. While the Powerplan Dashboard, covering cataloging, utilization reports, compliance, and accuracy, signifies a paradigm shift in streamlining patient care. Overall, these dashboards can be designed to give hospitals a comprehensive 360° view of their healthcare operations.
These dashboards present a dynamic and promising future for proactive and personalized patient care. As healthcare analytics evolves, these tools are set to play a crucial role in enhancing decision-making processes. They represent more than a technological upgrade; it symbolizes a fundamental shift in leveraging data for informed decision-making in healthcare. As the landscape matures, implementing such dashboards becomes indispensable, ensuring healthcare providers stay at the forefront of delivering optimal care in a complex and dynamic environment.


